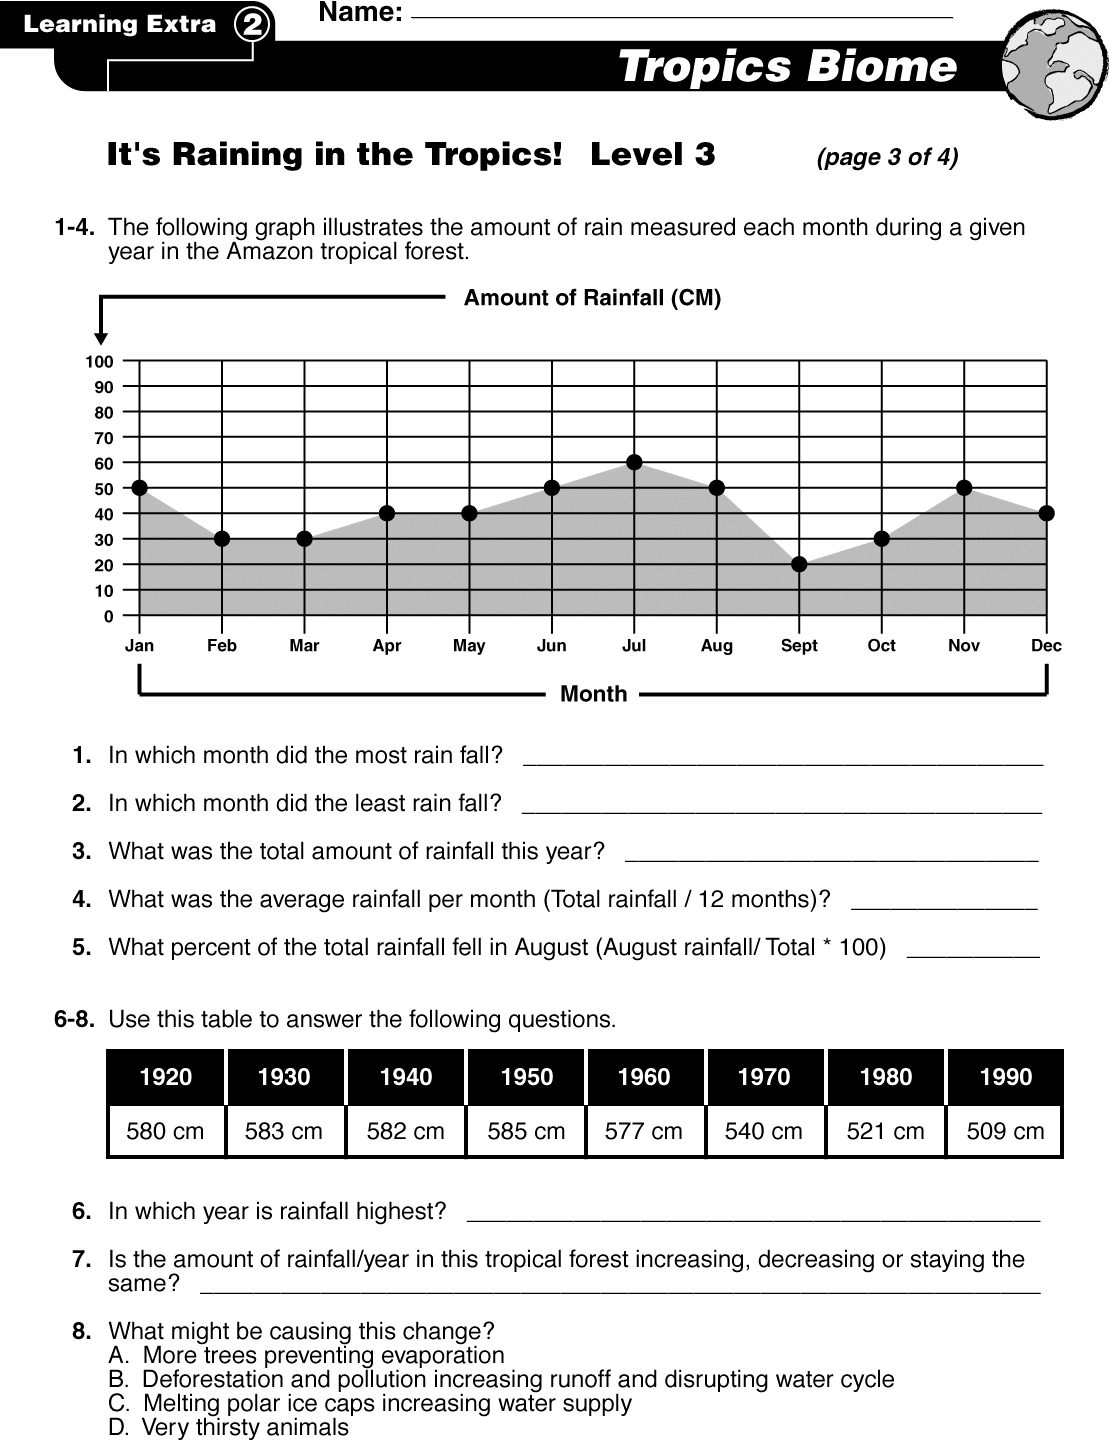
Labels:analyzer | autoradiograph | clock | crt screen | earth | fence | grass | oscilloscope | plant | sky | stairs | trade name | windowpane OCR: Learning Extra Name: Tropics Biome It's Raining in the Tropics! Level (page 3 af 4) 1-4. The following graph illustrates the amount of rain measured each month during given year ir the Amazon tropical forest. Amount of Rainfall CM) 100 06 80 20 Jan Feh Mar Apr May Jun Aug Sept Oct Nov Dec Month 1. In which month did the most rain tall? In which month did I the least rain fall? What was the total amount of rainfall this year? What was the average rainfall per month (Total rainfall / 12 months)? What percent of the total rainfall fell in August (August rainfall/ Total 100 6-8. Use this table to answer the following questions 1920 1930 1940 1950 1960 1970 1980 1990 580 cm 583 cm 582 cm 585 cm 577 cm 540 cm 521 cm 509 cm In which year is rainfall highest? 7. Is the amount of rainfall/year in t ...